Dashboard — Overview
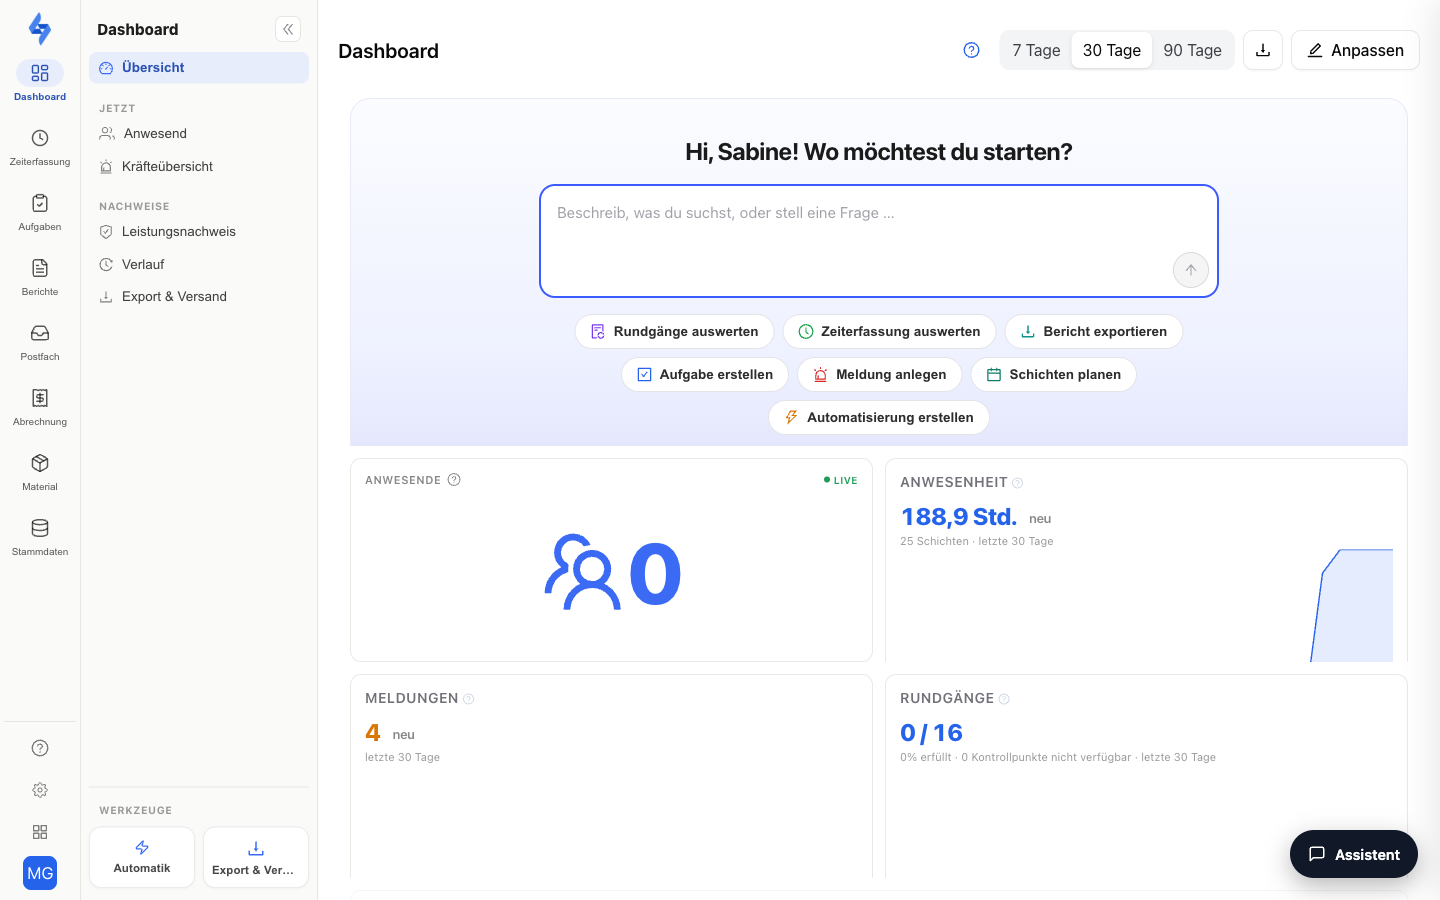
The Overview (menu item Dashboard → Overview) is the portal's entry point: a freely customizable widget dashboard with key figures, live attendance, map, trends, and recent activity. You assemble the view yourself — to match your role and industry.
What Is This View For?
The overview answers the daily opening question: Is everything running? — Who is currently present, how reliably are shifts and rounds running, which incidents are new, what happened most recently. From here you jump to the detail views (properties, activity, export & delivery) with one click. The dashboard answers "What is going on right now?" and "What do I need to do today?"; what you prove to customers and auditors lives in the Evidence group of the same panel.
The Sidebar on the Left
The Dashboard menu item brings together the overview and the Now group with the three live views:
| Entry | What for |
|---|---|
| Overview | This page: your widgets with key figures, live attendance, map, and trends |
| Now → Present | The attendance list (live): who is currently checked in at which property |
| Now → Force overview | Live status board: which status each person currently reports, where they are, and whether a proof-of-life check is overdue (requires the Force overview feature and the View force overview permission) — see Force overview |
| Now → Map | The live map of all properties with the device locations (requires the View live map permission) |
The analyses live in the Evidence group of the dashboard panel: Performance record (proves per property whether you are keeping your promises to the customer), Activity (the event log) and Export & Delivery (generate and send reports).
Features Overview
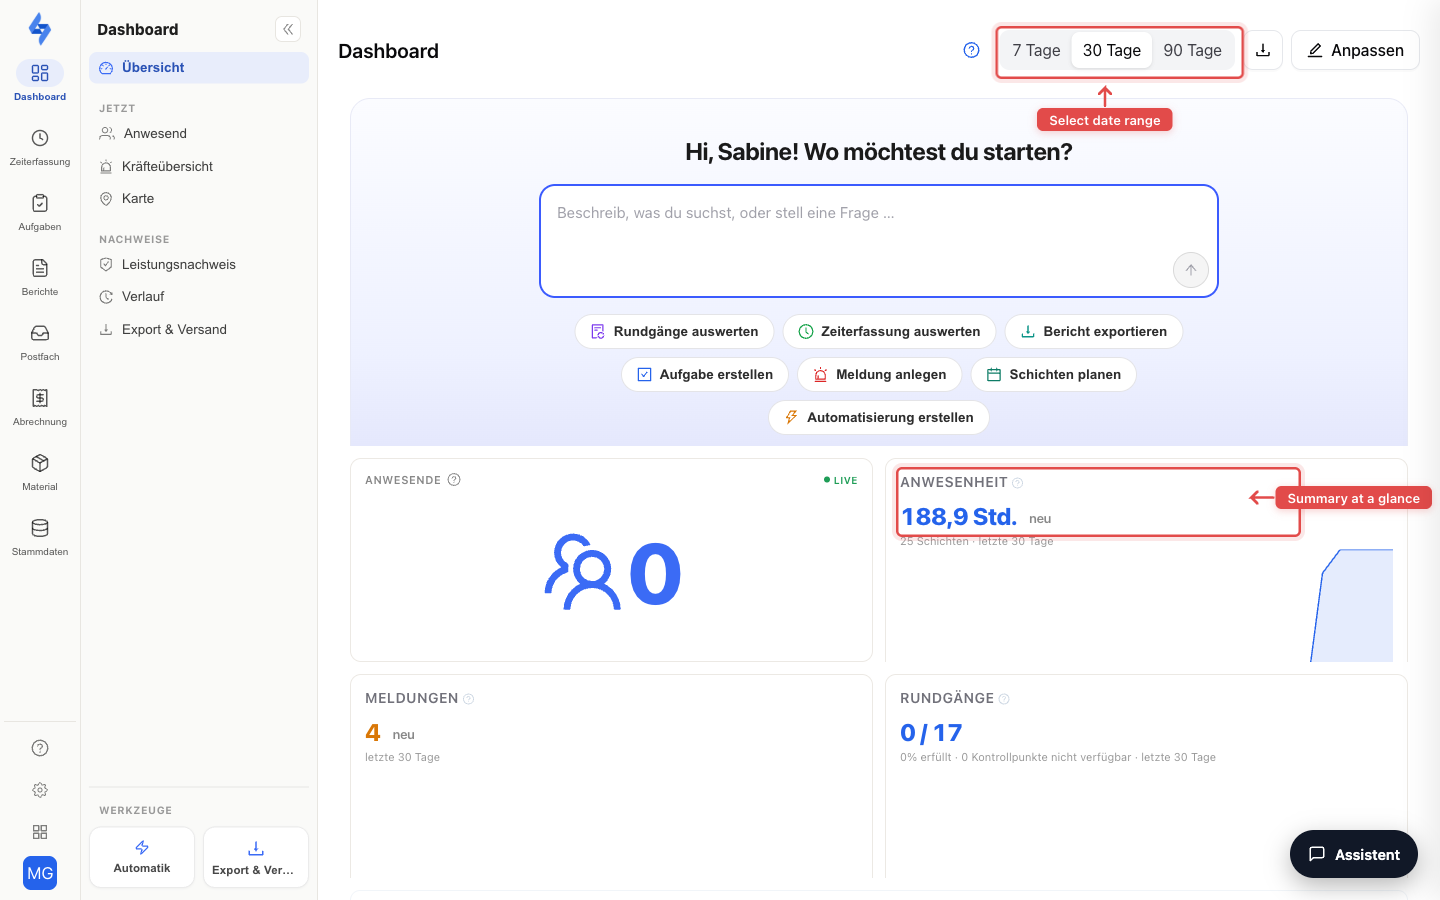
Time Range & PDF Export
At the top right you choose the evaluation period: 7 / 30 / 90 days (default: 30 days; the selection is preserved in the URL). The Export PDF button creates a report of the current dashboard in the background — you will then find it under Export & Delivery.
Customizing the Dashboard (Edit Mode)
Customize starts edit mode. A bar at the top edge shows the options:
| Action | Description |
|---|---|
| Add widget | Opens the widget catalog (filtered by category); add widgets individually or all at once |
| Move & resize | Arrange widgets by dragging and enlarge/shrink them at the edges |
| Settings (gear) | Widgets with settings (e.g. quick actions) show a gear in the tile bar; changes apply after Apply |
| Property restriction | Include only selected properties in the analytics (empty selection = all properties) |
| Templates | Apply ready-made LiteLog templates (Security, Cleaning & Facility, Care, Hotel & Hospitality, Attendance, Quick overview, Analytics), adopt layouts from your team, or reset the dashboard to the industry default layout. Each industry template only contains widgets whose data source the industry actually uses |
| Save / Cancel | Apply changes or restore the previous layout |
Widget Catalog
The widgets are grouped into categories: Time tracking, Attendance, Reports, Tasks & routes, Properties, Material, Activity.
| Widget | Shows |
|---|---|
| Attendance | Recorded hours and shifts in the period |
| Reliability | Punctuality metric of the shifts |
| Incidents | Number of incidents in the period |
| Walks | Fulfilled walks and checkpoints |
| Currently checked in / Live attendance | Who is currently checked in (updated live) |
| Live map | Properties and device locations on the map (requires View live map) |
| Tasks | Open tasks and walks, mixed by recency, with an overdue hint |
| Reports | The latest incidents and form responses |
| Property status / Property health | Traffic-light rating of your properties (OK / Watch / Critical, thresholds adjustable) |
| Activity | The latest events (as in the Activity log) |
| Hours trend / Cumulative hours | Weekly progression or cumulative curve of worked hours |
| Recent notifications / Recent exports | Most recently sent notifications or generated exports |
| Quick start | Personal greeting, a question box for the assistant, and the most common actions as shortcuts |
| Tasks today | What the team works on today: tasks, recurring items and patrols with time, site and assignee; overdue items as the first group |
| Duty today | Is the person on site who should be? Exceptions only: unstaffed shifts, started shifts without check-in, attendances without check-out; the header counts started shifts |
| Approvals | What is waiting for your decision: absence requests, material requests, reports pending review |
| Needs attention today | Everything that needs attention now: overdue tasks and patrols, attendances open unusually long, understaffed sites, pending absence requests, force-overview alarms, failed automations, open material requests — each row opens the matching list |
| Missed patrols | Scheduled patrols that did not run in the period: total, versus the previous period, per site |
| Roster today | First the unstaffed shifts today and tomorrow with time, site and assigned names, then the next shifts, below who is absent today |
| Material | Stock status of the central warehouse (low, empty, count needed) and open material requests (requires the material module to be enabled) |
| Force overview | Personnel status as numbers and the alarms (emergency, proof-of-life overdue) live (requires the Force overview feature) |
| Setup | Seven steps from an empty account to live operation, each linking to the right place; disappears on its own once everything is set up |
| Service level | Fulfilment of the service-level agreements: kept, at risk, missed (requires the Service level feature) |
| Automation failures | Failed rule executions of the last 30 days |
| Sites target vs. actual | All sites in the period with status light, shifts and patrols actual/target, late check-ins, open shifts and missing checkpoints, red first; a row opens the site |
| Quick actions | Compact list of the six most requested actions (add employee, add site, report, add time entry, patrols, export report); up to eight custom buttons (report with preselected category and site, form, task, page) via the gear in edit mode |
| Pending absences | Open requests with person, type, period and days; Decide opens the approval dialog right from the widget (requires Edit time tracking) |
Good to Know
:::tip Note
- Every widget has its own empty state (e.g. "Nobody is currently checked in"). If no data appears, first check the selected period and the property restriction.
- Layout changes are saved while you edit; Cancel restores the previous state.
- The layout belongs to your user, not to the company. Everyone sets up their own dashboard; your colleagues do not see your arrangement. To pass a layout on, your colleagues adopt it via Team templates.
- Accounts with the Customer role have no access to the dashboard. :::
Permissions
:::info Permission To use this page, you need the View round evaluation permission. Contact your administrator if you do not have access. :::
| Action | Permission |
|---|---|
| Open the page | View round evaluation |
| PDF export | Export round evaluation |
| Live map widget | View live map |